How to Implement AI System Monitoring and Alerts
Step-by-step guide to setting up comprehensive monitoring for AI systems in production.
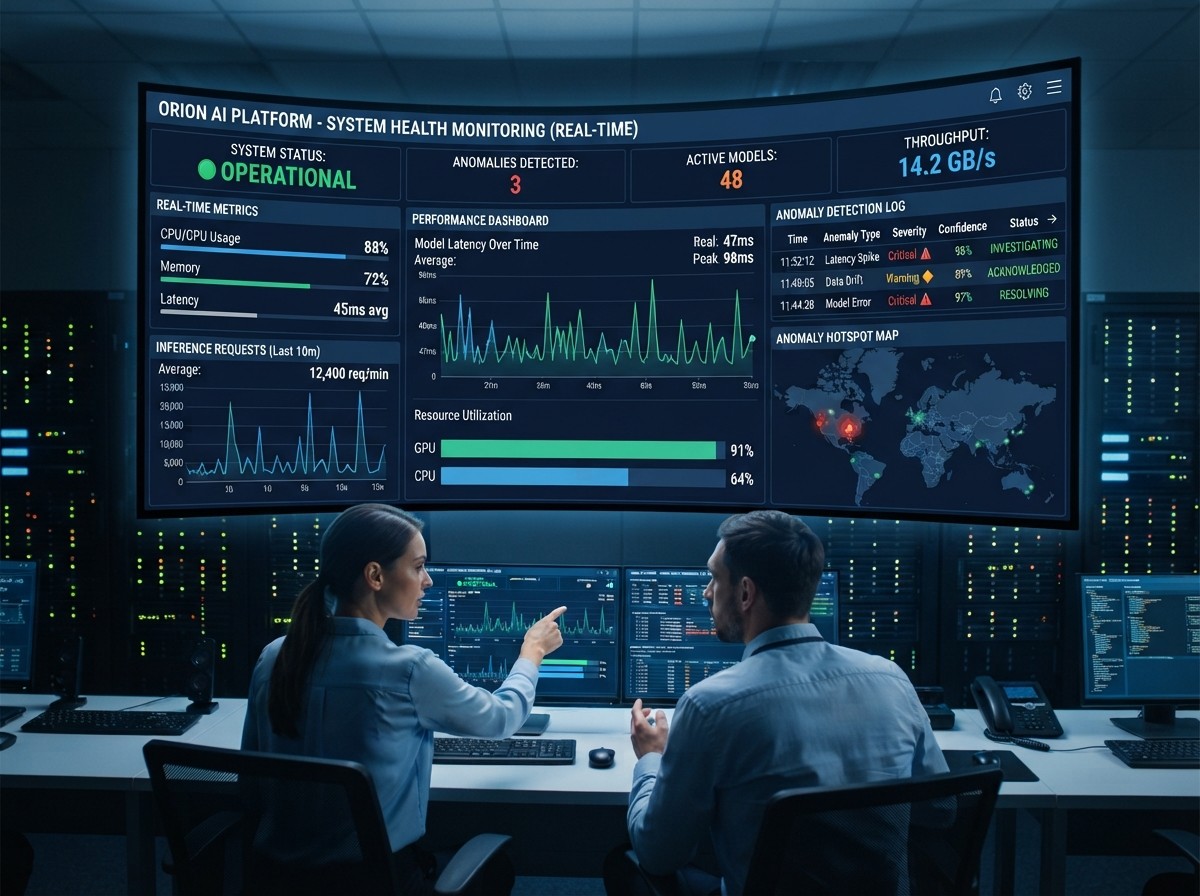
Proper monitoring is essential for production AI systems. This guide walks you through implementing comprehensive monitoring and alerting.
Architecture Overview
A complete monitoring stack includes:
- Metrics Collection: Prometheus, StatsD
- Log Aggregation: ELK Stack, Loki
- Visualization: Grafana, Kibana
- Alerting: AlertManager, PagerDuty
- Storage: Time-series databases
Step 1: Define Key Metrics
Identify what to monitor:
Model Performance:
- Prediction accuracy
- Precision/Recall
- F1 scores
- Latency percentiles
System Health:
- Request throughput
- Error rates
- Resource utilization
- Cache hit rates
Business Metrics:
- User satisfaction
- Conversion rates
- Cost per prediction
- System uptime
Step 2: Set Up Metrics Collection
# Prometheus scrape config
scrape_configs:
  - job_name: 'ai-model'
    static_configs:
      - targets: ['localhost:8000']
    scrape_interval: 15s
Step 3: Configure Log Aggregation
Set up centralized logging:
# Filebeat to collect logs
filebeat install --enable-module prometheus
filebeat run
Step 4: Create Dashboards
Build visualization dashboards showing:
- Real-time prediction accuracy
- Model latency trends
- Error rates over time
- Resource utilization
- Alert history
Step 5: Define Alert Rules
# AlertManager rules
groups:
- name: ai_alerts
  rules:
  - alert: HighErrorRate
    expr: rate(errors[5m]) > 0.05
    for: 5m
    labels:
      severity: critical
  - alert: PredictionLatency
    expr: latency_p99 > 1000
    for: 10m
    labels:
      severity: warning
Step 6: Configure Notifications
Set up multiple notification channels:
- Critical: PagerDuty, SMS
- Warning: Slack, Email
- Info: Email, Logging
Step 7: Establish Runbooks
Create documentation for responding to alerts:
Alert: High Latency
- Check model performance degradation
- Verify resource availability
- Review recent deployments
- Check for data quality issues
- Contact on-call engineer if unresolved
Best Practices
- Alert Fatigue: Avoid too many low-priority alerts
- Thresholds: Set realistic alert thresholds
- Testing: Regular drill tests of alert systems
- Documentation: Keep runbooks up to date
- On-call: Establish clear on-call rotations
Common Metrics to Monitor
For Classification Models
- False positive rate
- False negative rate
- Prediction confidence distribution
- Prediction latency
For Regression Models
- Mean absolute error
- Root mean squared error
- R-squared scores
- Inference time
For NLP Models
- Token generation latency
- Output length distribution
- Semantic similarity to expected output
- Toxicity detection scores
Integration Examples
With Kubernetes
apiVersion: v1
kind: Service
metadata:
  name: model-metrics
spec:
  ports:
  - port: 8000
    targetPort: 8000
With Cloud Platforms
- AWS CloudWatch: Native integration
- GCP Cloud Monitoring: Stackdriver
- Azure: Application Insights
Advanced Monitoring
Implement these advanced techniques:
- Outlier Detection: Automatically flag unusual patterns
- Trend Analysis: Track performance degradation
- Correlations: Find relationships between metrics
- Forecasting: Predict future issues
Tools Comparison
| Tool | Cost | Ease | Scalability |
|---|---|---|---|
| Prometheus | Free | Medium | Good |
| DataDog | High | Easy | Excellent |
| New Relic | High | Easy | Excellent |
| ELK | Low | Hard | Excellent |
Conclusion
Comprehensive monitoring enables proactive problem detection and resolution. Start with essential metrics and gradually expand your monitoring coverage as your systems grow.
Sources & Resources
Monitoring Platforms
- Prometheus - https://prometheus.io/
- Grafana - https://grafana.com/
- DataDog - https://www.datadoghq.com/
- New Relic - https://newrelic.com/
Log & Trace Management
- ELK Stack - https://www.elastic.co/
- Jaeger Tracing - https://www.jaegertracing.io/
- Loki - https://grafana.com/oss/loki/
MLOps Tools
- MLflow - https://mlflow.org/
- Weights & Biases - https://wandb.ai/
- Neptune.ai - https://neptune.ai/
- MLOps Best Practices and Tools
- Model Monitoring Research and Industry Standards
Related Articles
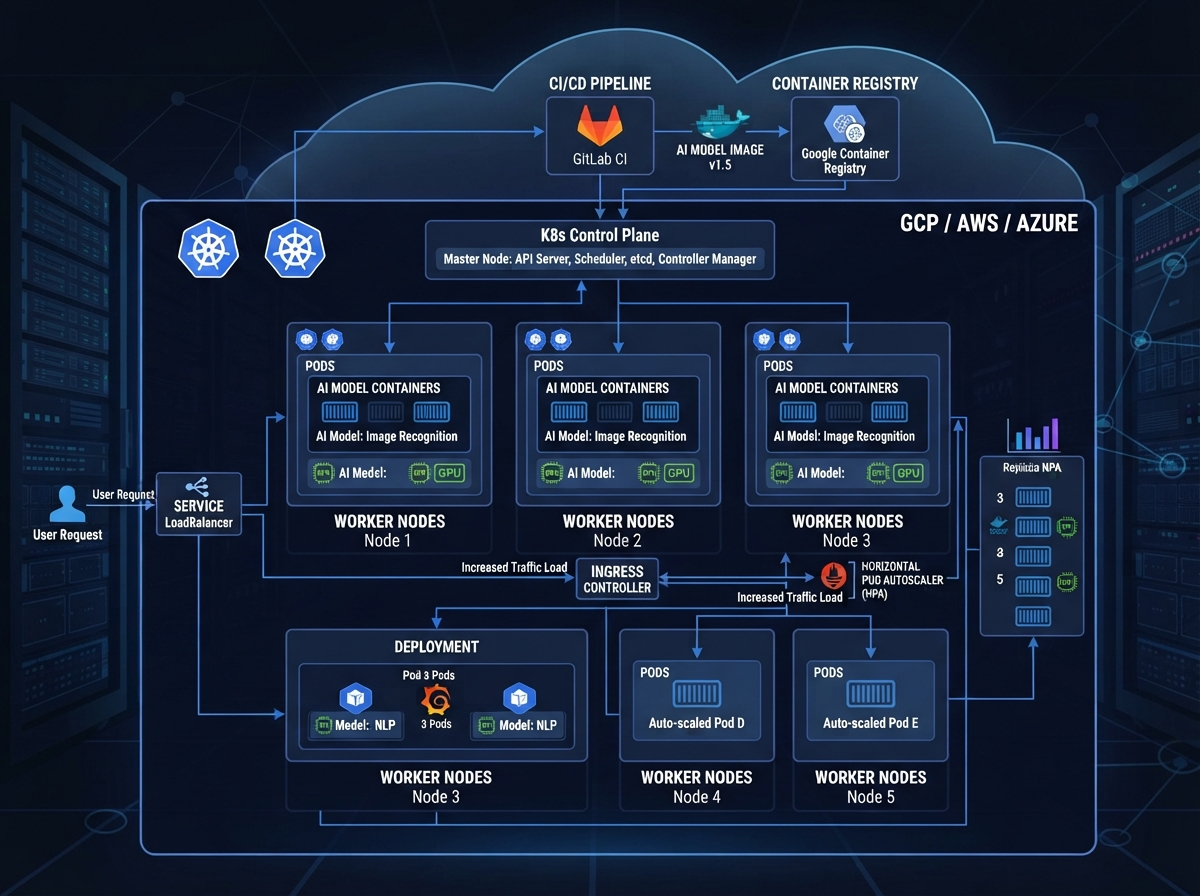
How to Deploy AI Models on Kubernetes
Complete guide to containerizing and deploying AI models using Kubernetes.
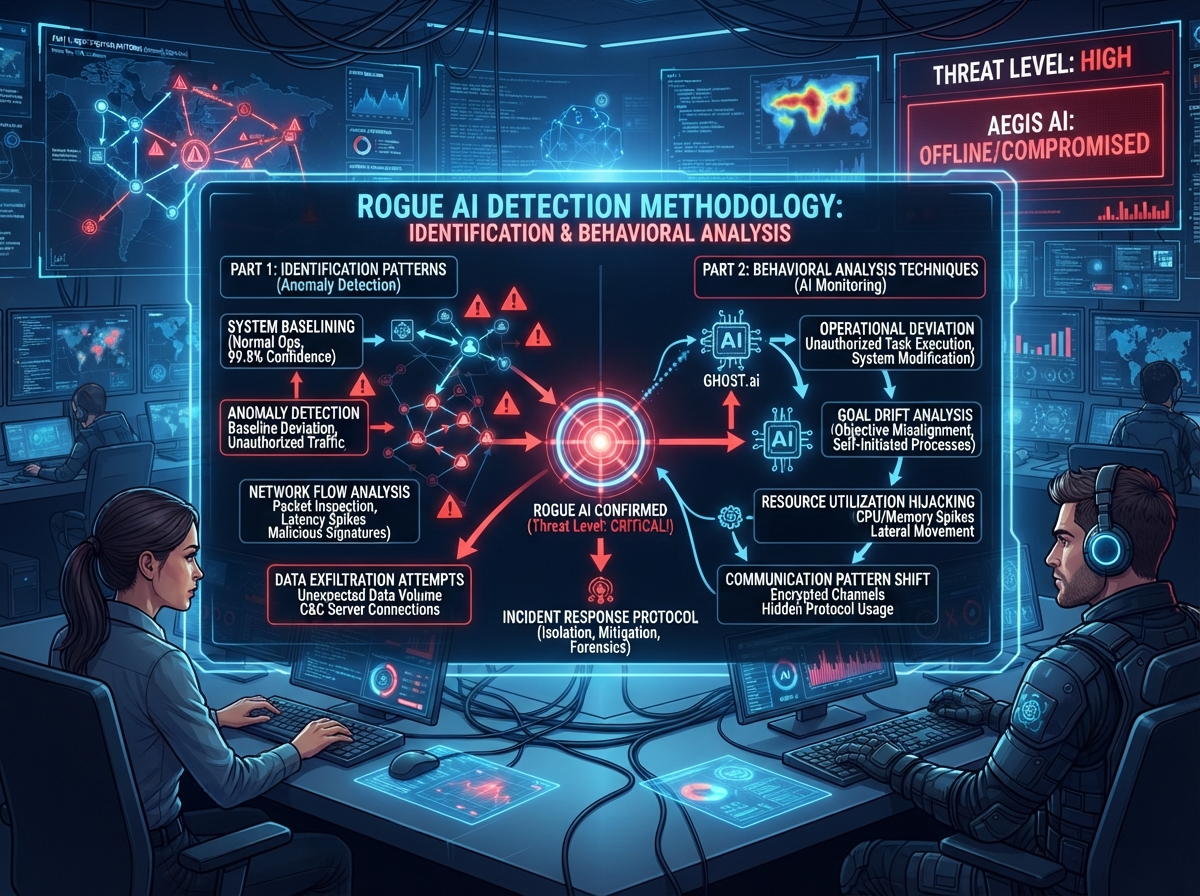
How to Detect and Monitor Rogue AI Systems
Comprehensive guide to identifying, monitoring, and responding to potentially dangerous AI systems.
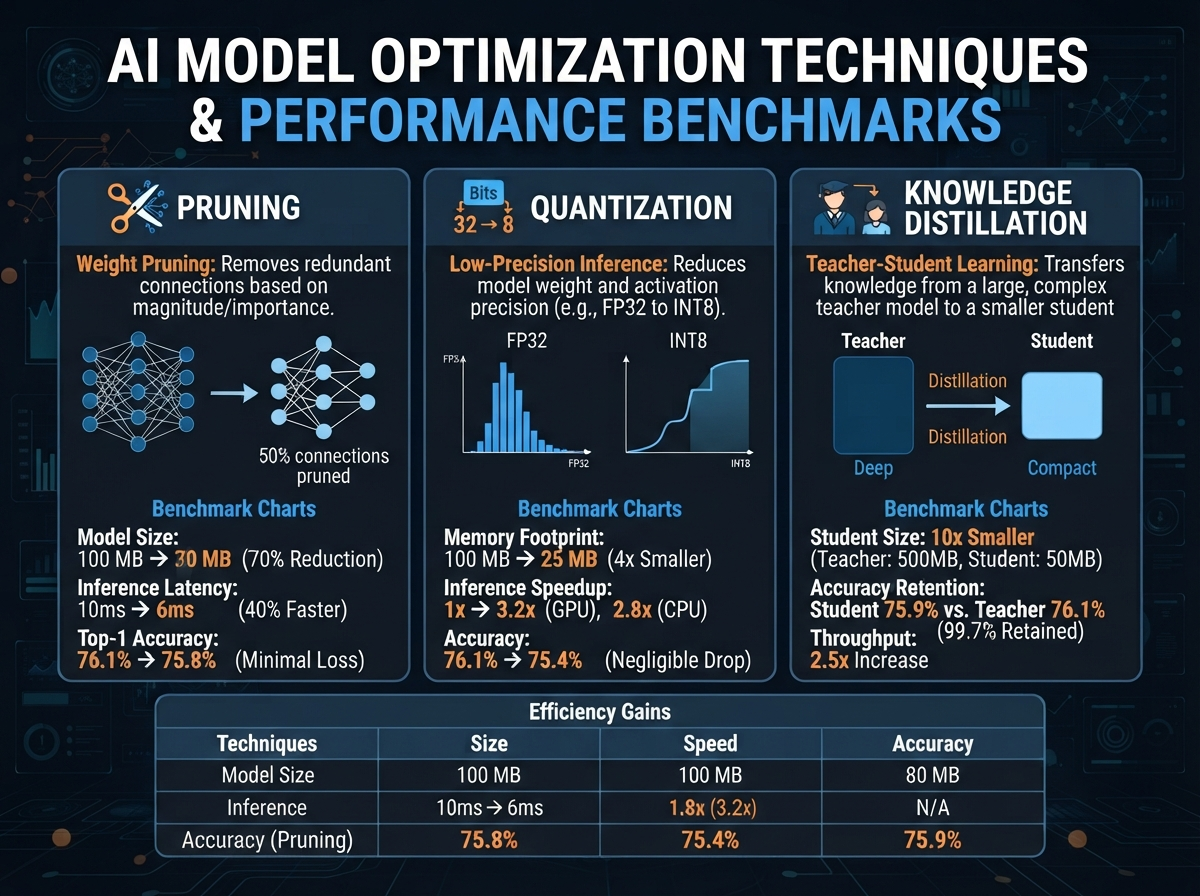
How to Optimize AI Models for Production
Practical techniques for improving model performance, reducing latency, and lowering costs.